
2026 Korea inbound tourism report · EP. 02
Hospitality insightsWhere do international visitors go? Read travel data when choosing a property
At a glance
Around eight in ten surveyed international visitors went to Seoul. Use regional and Seoul destination data to assess locations and improve arrival instructions.


At a glance
- Second-quarter 2026 visit rates were Seoul 78.6%, Busan 18.4%, Gyeonggi 12.3% and Jeju 10.4%.
- Popular Seoul locations included Myeongdong 74.0%, Gyeongbokgung 47.7% and Hongdae/Sinchon/Hapjeong 42.6%.
- A visit rate records visiting a place, not staying overnight there.
- For an operating property, check the final 300 m from station exit to entrance first.
- Walk candidate locations by day and night and consider large luggage.
Learn more
What to check after identifying a popular area
Prospective hosts often hear that a neighbourhood attracts international visitors. Operating hosts also want to know which attractions to explain. Official destination data helps, but visiting a city does not tell us whether someone stayed there or for how many nights.
The provisional second-quarter 2026 International Visitor Survey reported Seoul 78.6%, Busan 18.4%, Gyeonggi 12.3% and Jeju 10.4%. Respondents could visit several regions. Adding rates to divide a market, or multiplying them by national arrivals to estimate room demand, changes their meaning. National visitor survey
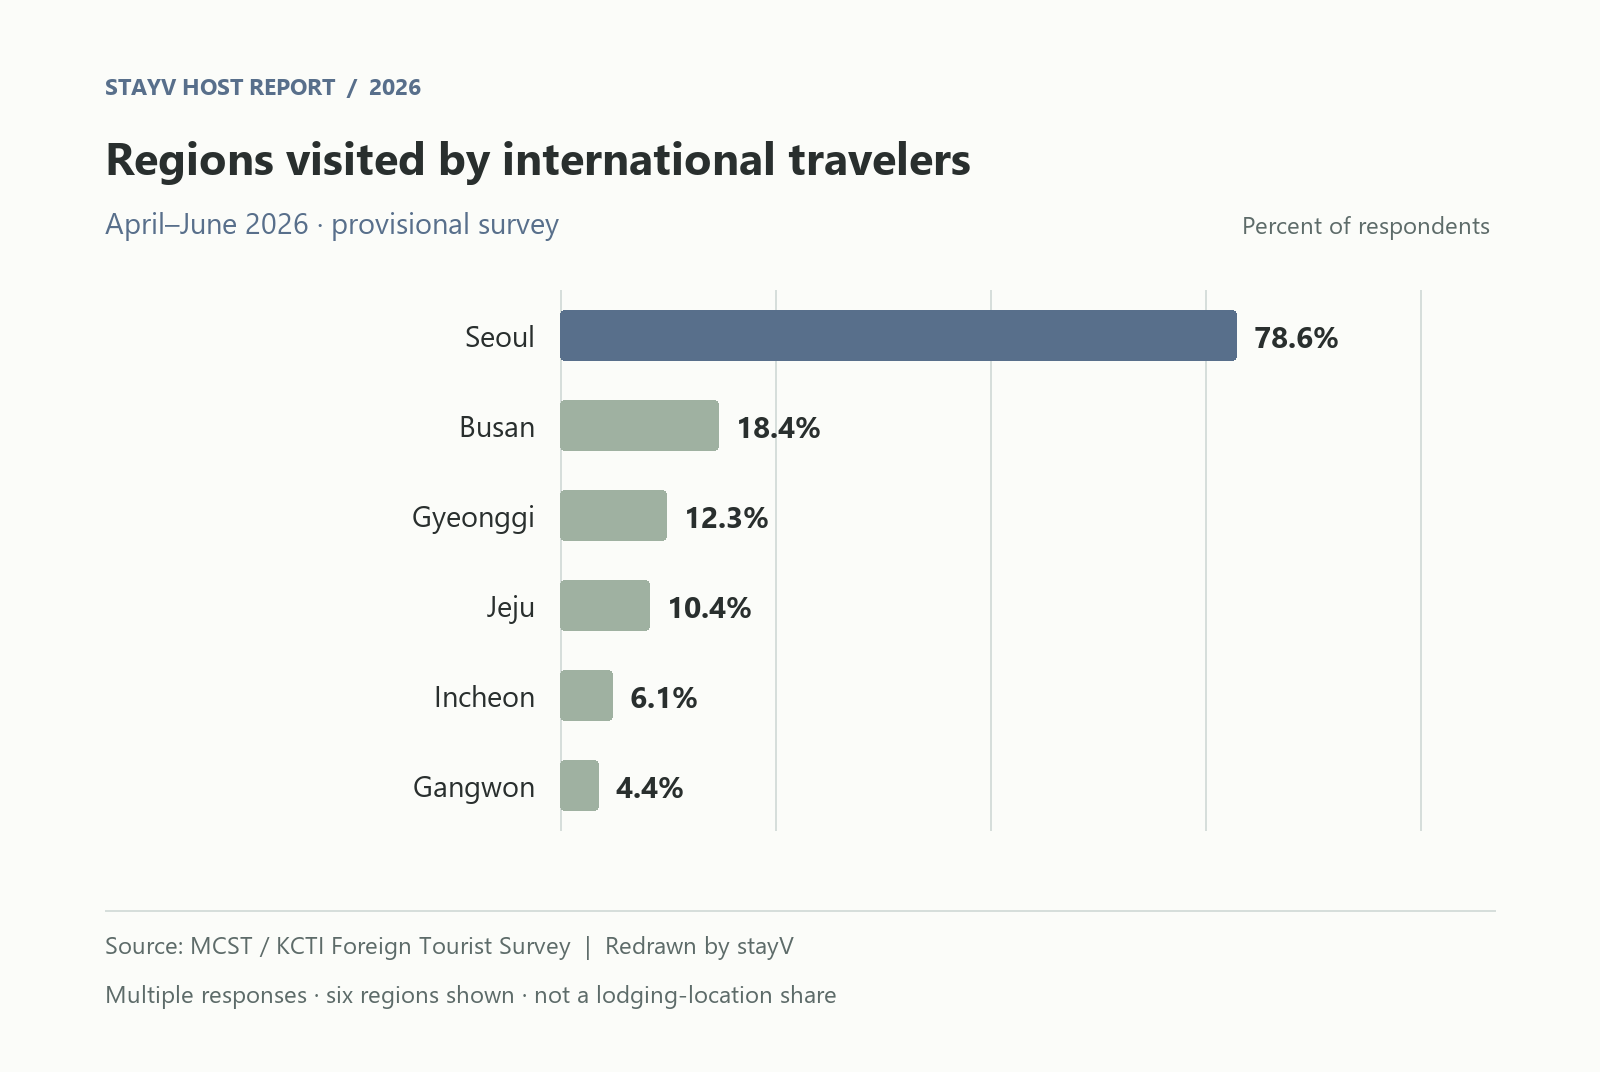
View graph figures in a table
| Category | Value |
|---|---|
| Seoul | 78.6% |
| Busan | 18.4% |
| Gyeonggi | 12.3% |
| Jeju | 10.4% |
| Incheon | 6.1% |
| Gangwon | 4.4% |
Seoul’s high rate means many travellers included it in their itinerary. For Busan or Jeju hosts, ask where your region fits: immediately after entry, after Seoul or before departure. Each stage creates different guidance needs.
Seoul contains several different travel areas
Seoul Tourism Organization’s third-round June 2026 provisional survey recorded visits to Myeongdong 74.0%, Gyeongbokgung 47.7%, Hongdae/Sinchon/Hapjeong 42.6%, Gangnam Station 41.5%, Seoul Forest/Seongsu 33.1% and Gwangjang Market 30.4%. These six selected locations help hosts think about routes; they are not the complete destination ranking. Seoul tourism survey
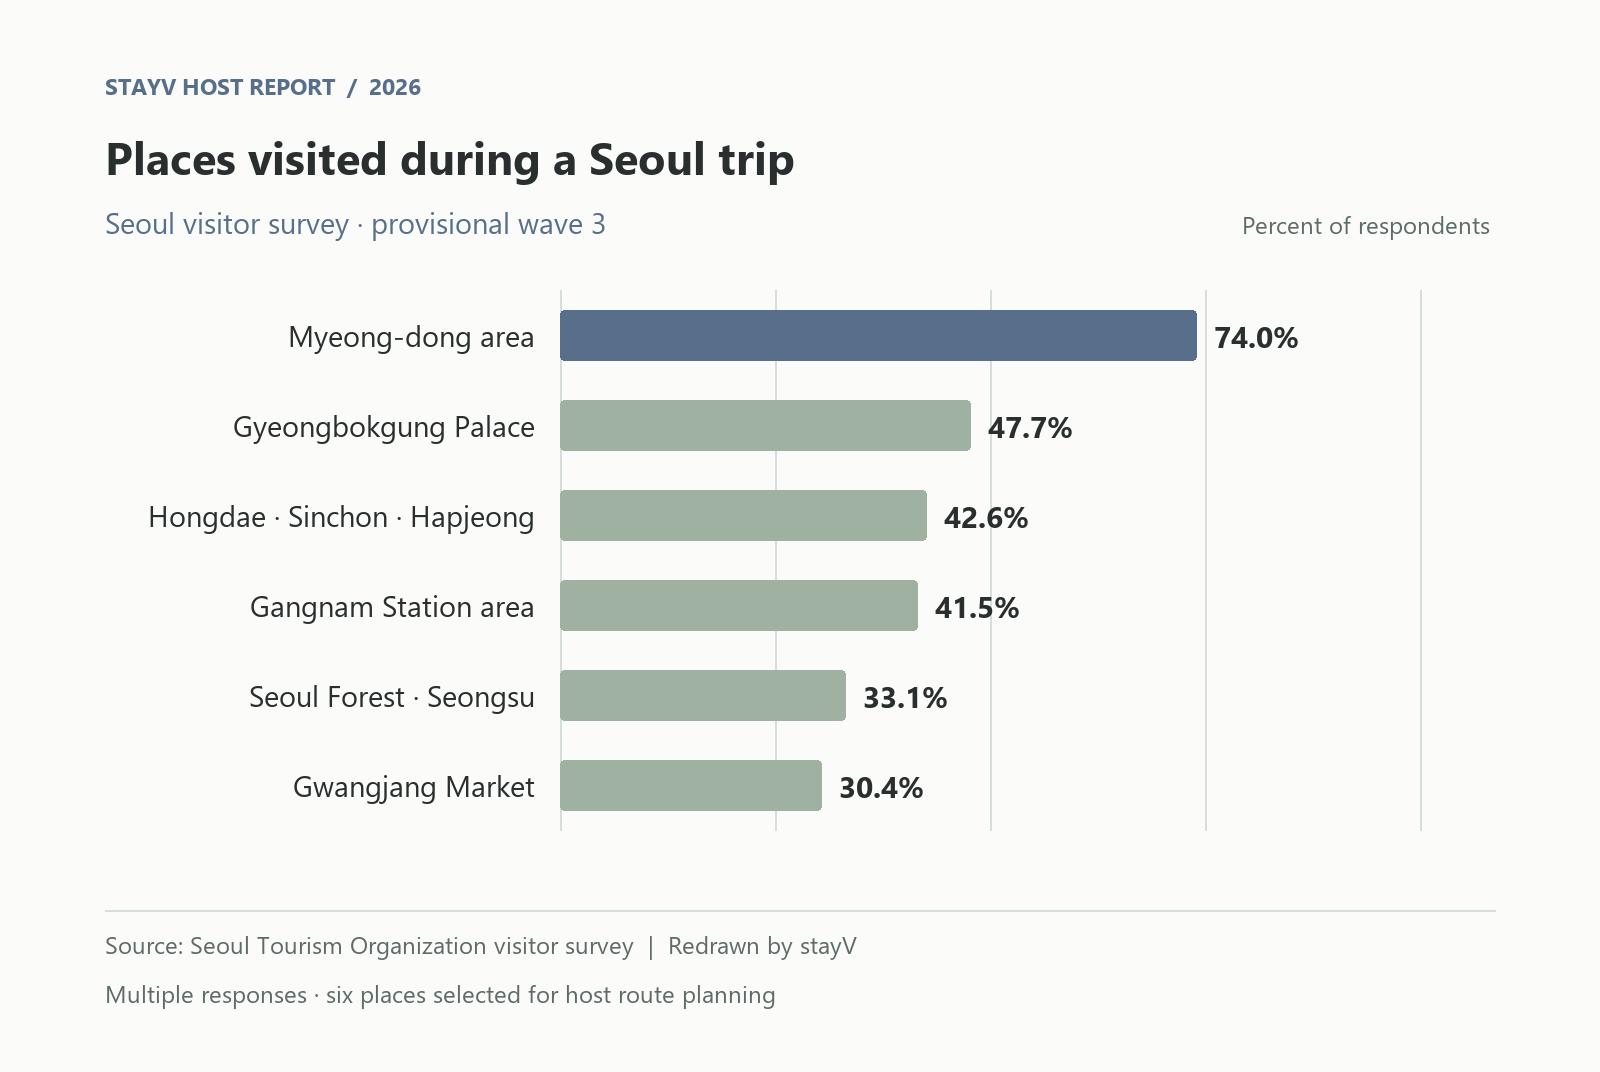
View graph figures in a table
| Category | Value |
|---|---|
| Myeongdong area | 74.0% |
| Gyeongbokgung Palace | 47.7% |
| Hongdae, Sinchon, Hapjeong | 42.6% |
| Gangnam Station area | 41.5% |
| Seoul Forest, Seongsu | 33.1% |
| Gwangjang Market | 30.4% |
Go beyond kilometres to Myeongdong. Check the actual return journey: transfers, late-night service and whether the entrance is easy to find when returning. Daytime sightseeing and evening travel can have different conditions.
These figures cannot recommend a particular lease. Floors, lifts, road access, noise and permitted business types differ even within a neighbourhood. Use statistics to create comparison questions, then verify the site and address conditions.
Improve the final approach at an operating property
The final 300 m may be harder than the airport journey. A map may lead to the wrong side of an alley, similar doors may sit beside each other, or all entrance photos may be taken in daylight. Familiarity makes these issues easy to miss.
Walk from the station exit guests use most. Photograph decision points and the final entrance rather than every scene. Update directions when signs or landmark shops change. Give distances and times you checked, and describe slopes or stairs honestly.
Consider taxi arrivals separately. If cars cannot reach the door, explain a safe drop-off and the walk from there. Check disclosure settings before making exact locations or entry details available to booked guests.
Compare property candidates with these questions
| Item | What to check on site |
|---|---|
| Main journey | Which airport, station or attraction journeys are convenient? |
| Luggage and stairs | Are there slopes, stairs or narrow doors? |
| Evening return | Is the entrance recognisable and well lit at night? |
| Daily needs | Are food, groceries and laundry within walking reach? |
| Noise and neighbours | How do late returns and luggage movement affect neighbours? |
| Business conditions | Is the intended accommodation business permitted at this address? |
The goal is to test assumptions, not simply assign scores. “We can explain the stairs” may feel different after carrying luggage repeatedly. Separate inconveniences guidance can solve from those requiring facility changes.
Regional hosts should start routes at their own property
Outside Seoul, begin with the station or terminal guests actually arrive at, a practical local walk and dinner options. Check available transport carefully rather than filling the guide with distant famous attractions.
Consider both popularity and usefulness to your guests. Explain whether a car is needed, whether a place suits rain and whether guests can walk back, so they can choose for their itinerary.
Make location advantages concrete in stayV
In stayV, separate arrival guidance from nearby places. Arrival covers the journey and entrance photos; nearby information helps guests explore during the stay. This keeps navigation and sightseeing from becoming mixed together.
A map pin alone does not finish guidance. Check routes, place information and key sentences in guests’ languages. Operating hosts can start with one main route before the next arrival; prospective hosts can draft how to explain a candidate property’s advantages.
Explore stayV Host · Write arrival instructions · Use maps and nearby information
Data basis and sources
Regional visit rates use the provisional second-quarter 2026 International Visitor Survey, PDF page 18. Seoul destinations use the third-round June provisional survey, report pages 37–38. These are multiple-response rates. stayV redrew the official figures; location and guidance advice is its interpretation. Visited regions are not treated as overnight-stay regions, and visitor numbers are not treated as room occupancy.